
Note: This blog post was written using Universal Analytics, which has been shut down. You can find newer posts covering Google Analytics 4 here.
Google Analytics is a beast of a tool. It’s so robust it can be tough to get a grasp of, especially if you don’t spend a lot of your day geeking out over website data. As opening Google Analytics quickly reveals, there are a wide variety of reports available with the simple click of your mouse.
Some reports are easy to find, easy to understand and easy to feel good about. Other reports are a bit more buried, are tougher to interpret and require some manipulation to make them very meaningful. The Landing Pages report falls more into this second camp.
But oftentimes it’s these more difficult reports that can yield some very interesting data. Below we’ll dive into the Landing Pages report and offer some tips on gleaning valuable insights from what it reveals.
Where is the Landing Pages Report?
Find updated steps for finding your site’s top landing pages in Google Analytics 4.
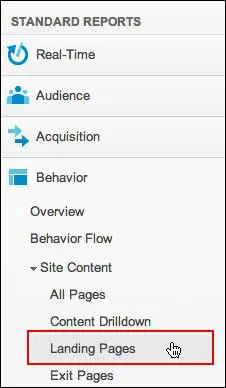
First thing’s first, where can you find the report? You can access the Landing Pages report by clicking the following:
Behavior > Site Content > Landing Pages
What Does the Landing Pages Report Show?
As soon as you open the report, you’ll see the most popular landing pages on your website, arranged by number of visitors that have landed on each page over the specified time period. It’ll look like this:

Using the above example, you can see that 807 visitors entered our website through a blog post about water damage to a cellphone (which is clearly not a great fit for what we’re targeting on our blog, but that’s the topic of another post altogether).
In addition to visits, the Landing Pages report shows us a bunch of useful data, including:
- Pages/Visit: The number of pages that a user visits after landing on the initial page. The higher the number, the more engagement your landing page is promoting.
- Avg. Visit Duration: The average length of time a visitor stays on your website. This number isn’t entirely accurate for a few reasons, but can be useful as a way of comparing page performance relative to other pages.
- % New Visits: The percentage of visitors that have not previously visited your website.
- Bounce Rate: The percentage of users that arrive on your landing page and leave your website without viewing any additional pages. A lower bounce rate is generally the goal.
Why Use the Landing Pages Report?
You can use the Landing Pages report to help your organization answer a variety of questions about the performance of your website. If you’re interested, we’ve put together additional tips for making a website analytics report for your nonprofit.
What pages are serving as an introduction to your website?
The Landing Pages report shows you which pages are greeting your website visitors. These landing pages are oftentimes the first experience a visitor has with your website.
Maybe you have a great homepage, but if most of your visitors are landing on your site by way of your blog, you may want to be more strategic about what they see when they arrive. It may be helpful to include easily accessible information about your organization since many blog readers won’t know who you are or what you do.
How well is each landing page performing?
Which pages are prompting your visitors to explore further? And which pages are causing visitors to bounce? The Landing Pages report can show you which of your pages are effectively drawing visitors into your site, allowing you to take best practices from a page that’s working well and apply them to other pages.
Which blog posts are driving the most traffic to my website?
Many organizations create a blog to drive traffic. By applying an advanced filter, you can see which of your blog posts are driving the most traffic to your website. You can also see which posts are driving visitors that end up viewing more pages on your website.
What pages are different segments of traffic landing on?
If you’ve set up advanced segments in Google Analytics, use them to see how different groups of people arrive on your website. If you haven’t set up advanced segments, use this guide from SEOmoz to do so.
For instance, we can filter our total traffic to only show visitors coming from social media.

From here we can see the same metrics as before, but only for this subset of our overall website traffic. We can see what pages on our website are most appealing to our social media connections and which ones perform well relative to one another.
How well is each landing page converting?
If you’ve set up goals in Google Analytics, you can see the conversion rate for each of your landing pages. For a nonprofit, some goals may include people that ultimately donate to your organization, sign up for your email newsletter or register to volunteer.
By selecting the appropriate Goal Set (pictured below) that contains the relevant goals you’ve set up, you can see which pages are leading visitors to take the actions you’ve deemed a successful conversion on your website.

Using Advanced Filters to Get More Information
If you want to get even more specific with the Landing Page reports you run, you can apply Advanced Filters. Doing so is pretty straightforward:
- Click “advanced” above the data tables.
- Enter the criteria you’d like to use to create your filter.
- Click the “Apply” button underneath your filter criteria.
Your data will now be filtered by whatever criteria you’ve specified.
Advanced Filter Example: Compare Blog Posts as Landing Pages
As an example, let’s say you want to know how well your blog posts are performing as landing pages. If the URL for your blog posts contains the word “blog,” you’re pretty much all set. If not, start by figuring out some sort of criteria that will show only traffic that lands on your blog.
To set up your advanced filter, enter the following information:

You’ll then see only those landing pages that match your filter criteria:

Have you ever used the Landing Pages report in Google Analytics? Or do you have another report you’d like us to cover? I’d love to hear what you think.
Image courtesy of Rob Ellis, Flickr
What You Should Do Now
01. Come to Nonprofit Website Office Hours
We cover a new topic every few weeks. Plus get a live answer to any website-related question you're wrestling with.
02. Book a Website Call
Find a time to discuss your nonprofit's website needs. Discover what's worked for other nonprofits like you and see how easy building your new site can be.
03. Start a Free Website Trial
Try our nonprofit website platform for yourself. Instantly get access to every feature to see if it's the right fit for your needs. No credit card required.
Do you know if there is a report that shows the total number of unique landing pages during a period of time, such as month?
Hi Si. In order to see the total number of unique landing pages over a period of time, first set the time period in the upper right. You can then go to the same Landing Pages report detailed in the above post.
If you look in the bottom right of the screen, you can specify the number of rows to show at one time. But to the right of the dropdown menu it’ll say “1-10 of #”. That number (#) is the total number of unique landing pages during the time you specified.
I hope that helps. If I can help anymore please let me know. Thanks for commenting.
Was doing some research on GA to figure my way in and found your site, lots of good info here.
Thanks a lot Bill. Glad to hear you’re finding the posts on Google Analytics helpful. Appreciate you taking the time to comment.
Thanks – I was precisely looking for how to get Landing Pages report in GA! Very nice post!
Thanks a lot Laure. Really appreciate you taking the time to comment. I’m glad you found the post helpful.
Hi there!
I try to see what landing pages the users got to using a specific key word (for example “Lisa”).
The report says that most landings has been done on my home page, not on the sub page where I want them to land.
But, when I try to Google “Lisa” and click on the first link to my company that I fin on Google, I get to the sub page I want.
How come that GA doesn’t show the landings on the sub page instead of to the home page?
Why is this you think?
I really would like to be able to see what keywords that has been used and where they land, not only the home page.
Am I “messy” here or…?
I really hope you can help me 🙂
Many thanks in advance!
Lisa
Hi Lisa. It’s hard for me to know exactly what’s going on without seeing your website and analytics, but I have a few questions that may help you diagnose the problem.
Are you seeing any analytics information for the subpage you mention? If not, it’s likely there’s something wrong with the way the analytics code is implemented on your site.
If you are getting data for this subpage, when you go to the Landing Pages report, what info do you see under “Source”? Are you seeing any traffic from search engines? You can also look at “Keyword” to see what keywords are leading visitors to your website.
When you Google your keyword phrase, are you using a browser that isn’t logged in to Google? I’d recommend using a browser you don’t generally use to make sure you aren’t seeing personalized search results.
Hope this helps Lisa.
Very helpful. Thanks!
You’re welcome Andy. Glad to hear it was helpful.
This was very useful and helped me find exactly what I needed, thanks!
Awesome! Glad to hear it Amy. Thanks for taking the time to let us know.
So we have inserted hyperlinks within content (articles/columns) on our site that lead to a ticket page wherein if people purchase tickets via this link we get a percentage of the profit. I am trying to track how many click thrus have occurred via the links within our content. Is that possible? Thank you!
Hey Jenn. It’s a bit tough to get into the specifics of tracking such clicks without a bit more info. But it’s almost certainly possible.
I’m assuming the page you’re sending visitors to is outside of your website?
If so, you could use the method outlined here, but it’ll take some setting up: https://support.google.com/analytics/answer/1136920?hl=en
If you’re running a WordPress site, you could also use a plugin like Yoast’s Google Analytics (http://wordpress.org/plugins/google-analytics-for-wordpress/) which allows you to track outbound links.
If this doesn’t answer your question, feel free to include a link and we can take a look at it. Thanks for the comment.
what does this / mean ? How can my landing page be /? don’t understand
The “/” is what Google Analytics displays for your home page. If your URL for your About page is “www.website.org/about” Google Analytics would display “/about” as the landing page. Since the home page has no additional page information beyond your root domain (www.website.org) it just displays “/”.
Hope that helps!
i don’t even have the category Content, much less Landing Page .
i do find Landing Pages under SEO in the Acquisitions category. but when i click on it i’m taken to a page that says :
This report requires Webmaster Tools to be enabled.
Set up Webmaster Tools data sharing.
i go thru the set up process, hit Save. the word Success appears, but every time i go back to Landing Pages i get the same message as above.
i’d be most grateful for any suggestions you may have.
thank you!
Hi Lisa. Google Analytics actually recently launched some major changes, one of which was to change the menu items in the lefthand sidebar.
But you can still get the Landing Pages report mentioned in this post, it’s just in a new place. You can find it by going to:
Behavior > Site Content > Landing Pages
From that point you should be able to do most of the other things outlined in the post.
With regards to linking Webmaster Tools to Google Analytics, here’s the official Google post on how to do it: https://support.google.com/webmasters/answer/1120006?hl=en
thank you so much, David! this works: Behavior > Site Content > Landing Pages
but when i went to this link https://support.google.com/webmasters/answer/1120006?hl=en
it tells me to go to the Webmaster Tools home page. any idea how to find that?
Awesome! Glad to hear that report is working for you Lisa. You should be able to get to the Webmaster Tools homepage here: https://www.google.com/webmasters/tools
If you haven’t set it up yet, you’ll need to go through the process of adding your site before you can pull that data into Google Analytics.
Here’s Google’s outline of how to do so: https://support.google.com/webmasters/answer/34592?hl=en
Hope this helps!
wow, this is probably more than i can take on right now, but will save your instructions for when i get a window. thank you so much for all your help and linkaging!
Hi,
How do I figure out the number of clicks on certain element of my homepage? i.e. I don’t want to know how many pageviews a particular article had, I want to know how many people found that article after clicking the link I posted for it on my homepage banner. Trying to find out how effective promoting it on the homepage like that was.
Thanks!!
Hey Michelle. If the banner is the only link to that page on the homepage it’ll be pretty straightforward and you won’t have to do anything custom.
The easiest way (assuming it’s the only link from the homepage) is to do the following:
1. Click Behavior > Site Content > All Pages
2. Click the URL for the article you’re interested in
3. Click the “Navigation Summary” tab just above the visitor graph
4. Look for “/” in the Previous Page Path list
That will show you the number of visitors that arrived on your article by way of the homepage. If that won’t work given you situation let me know. Hope it helps.
Hey David,
Thank you!
Yes, the banner is the only way to get to the page in question via the homepage, so we’re fine.
This worked great! Thank you so much!
Glad it worked Michelle! Thanks for letting me know.
thanks for the help : )
Hey There,
I am having a slight difficulty understanding certain landing page elements. Example, I have filtered Aquisition>Channels>Email … Then I have applied a campaign filter, and a secondary dimension of “Landing Page”, however, when I click to view the landing page it takes me somewhere else. I can see landing page only shows the extension of the website, so this may be a problem, but for example; If I sent an email with the link spares.aeg.ie/index, the landing page element when I click on it takes me to aeg.ie/index – two different websites…
Pretty sure I could simplify that more, sorry to ramble…
Thanks!
Thanks a lot for the comment Shantelle. I’m sorry to hear you’re having trouble with the report. I’m happy to help, but I’m a little unclear exactly what the issue is.
When you say you’re taken to a different website, what are you clicking? What are you looking to do that isn’t working correctly?
If I can get a bit more clarity on the issue hopefully we can figure out a solution.
Hi David,
I’m having a wordpress blog under my website http://craftinggenius.in. I’ve setup google analytics for this website. I’m getting all the visits count and everything for my landing page, but the visits flow isn’t showing for my blog under it. Do I need to have a separate google analytics for my blog?
Hi Kiran. Sorry to hear you’re having trouble with tracking blog content. As long as your blog is incorporated into your website and you have the tracking code installed on it, you won’t need a separate analytics install for it. How is your Google Analytics installed currently on your website? How did you install the tracking code? Let me know whenever you get a chance and hopefully we can figure out a solution.
Hi David, my website is a single page design and wordpress blog is installed on my webhosting under the directory name blog. I’ve installed the Google Analytics tracking code on my index.html file. But not on any other pages. Should i’ve to install the google analytics on my wordpress blog too?
Hi Kiran. In looking at the code we can see it seems the analytics code is pulling to the blog page as well. You are right on, you’ll need to make sure it’s loading up on each page you want to track.
It’s a bit hard to troubleshoot from afar, but here’s the overview from Google on installing the code: https://support.google.com/analytics/answer/1008080?hl=en
Hope this is helpful!
David,
Thank you for this post….it looks like I find the report in a different area under:
Acquisition >> Search Engine Optimization >> Landing Pages.
One thing that surprises me is that I don’t see my home page nor the order page…..my two most popular pages.
Can you think of a reason why I wouldn’t see those on this report?
Thanks!
Steve
Hey Steve. The report you’re looking at is actually slightly different than the one outlined in this post. The Landing Pages report under Acquisition >> Search Engine Optimization is going to show you how often your pages are showing up in Google search results (impressions), as well as the number of clicks, average page position and click through rates.
If you’re looking for the top landing pages (across all types of traffic) throughout your site, you’ll want to stick to the report outlined in the post under Behavior >> Site Content. In this report, your homepage will show as “/”. If you have any trouble, let me know.
Thanks for the comment. Glad you found the post helpful.
I’ve been seeing “/user/BardonsOliver” in my landing pages listing (under landing page). I can’t begin to imagine where that is, because we haven’t got a page like that on our site. Do you have any suggestions as to what this might mean? We sure don’t have “users” in as many places as this shows up.
Hi Janet. There could be a few reasons you’re seeing this issue. First off I’d recommend visiting that URL (www.yourdomain.com/user/BardonsOliver) to see if anything comes up.
There are a couple potential causes that come to mind. It could be your tracking code is being used elsewhere on the web. Or, if your code is on your 404 (“Page Not Found”) page, it could be you’re tracking people using bad links/URLs and those are showing up in your data.
You can also investigate a little further within the Landing Pages report. From the dropdown that says “Secondary dimension” select Acquisition > Source/Medium. Then, in the search bar to the right (beside the word “advanced”), enter “user” since that is in the URL you’re investigating. This will show you the source and medium from which visitors are landing on those pages with “user” in the URL. It may help you diagnose the root of the problem.
These things are a bit hard to diagnose without being in there personally, but hopefully these steps will point you in the right direction. Good luck!
Thanks for this info! It’s truly appreciated and helpful to someone like myself just starting to figure out how GA works. I also loved your post, “5 Fundraising Metrics Worth Monitoring in Google Analytics”.
Thanks a lot Thomas! Glad to hear you found the post helpful.
I have thought landing page is the page users go after they visit the homepage, but now I see I was wrong. Thanks for helpful information.
You’re very welcome. Glad to hear the post was helpful!
Hello there. I am new to Google analytics. What does it mean when one of my landing pages only shows the symbol / ?
It has quite a few visits but I’m not sure what the landing page is.
Thank you.
Keith
The / symbol is for your homepage Keith. All of those visitors are landing on your homepage. Best of luck with Google Analytics! It’s a whole lot of fun once you get comfortable with it.
Thank you for your quick response David!
I feel silly now for asking such a newbie question. Oh well, I have to start somewhere!
Thank you again!
Keith
Of course Keith. And no need to feel silly. We all have questions when diving into something new. Good luck!
Thanks for this info!
Is there a way to display landing page results (or any other results) based on post title instead of URL? Thanks!
I think your best bet is going to be using the Secondary Dimension dropdown. You should see this just above the table with all of your data.
In the Secondary Dimension dropdown, select: Behavior > Page Title.
Is that what you had in mind? If not, let me know and I’ll see what I can do. Hope that helps.
Thank you! I was confused sorting through those secondary options. Great info.
I don’t blame you. There are a lot of options in there. Glad to help out.
please tell me that if i have to do analysis of my home page via analytics how i should approach
Thanks for the question Ashish. It’s hard to give too many details without knowing the ins and outs of what you’re looking to achieve, but I’d recommend looking at a few things right away.
First, what’s the bounce rate? That’ll tell you if folks are easily finding what it is they’re looking for.
Second, where do visitors go after they visit your homepage? That’ll tell you if you’re driving traffic to the pages you hope to.
Third, if you’ve enabled goal tracking, are visitors from the homepage ultimately going on to complete a goal? If so, which ones? This can tell you if your homepage is ultimately helping you in the ways you hoped it would.
Again, just a rough starting point, but hopefully it’s helpful in your analysis.
Hello,
I do not have the word BLOG in my URLs, so I am thinking to put on blog pages an EVENT, is it the way to do ?
But I can’t make it, so please could you tell me what should be an event that will inform Analytics that a page is a blog post ?
Thank you.
Thanks a lot for your comment and sorry for the delayed response. Without knowing the specifics of your situation and setup, my first thought is your best bet may be to use Content Groups. You can find out more about that here: https://support.google.com/analytics/answer/2853546?hl=en
Here’s another post that dives into a bit more depth about classifying blog posts using Content Groupings: http://www.lunametrics.com/blog/2014/01/24/classify-blog-posts-analytics-content-groupings/
I hope that’s helpful!
Hi David –
What’s the best way to measure effectiveness of landing pages for ecommerce? For example, we have a landing page for a particular product. We would like to understand if this landing page is actually improving key metrics for customers we direct there or not.
I’m capable, but I’m not a GA expert so the more detail your generosity and time allow the better. 🙂
Thanks so much!
Terry
Hi Terry,
Great question and sorry for the delayed response. For Ecommerce, it’s all going to come down to enabling Ecommerce tracking in Google Analytics. This will allow you to see a vast array of data. Not only will you get conversion rates, but you can actually see the value of each page as well as transaction data by traffic source. From there you can evaluate the effectiveness of your marketing efforts and even calculate the average value of a visitor from each traffic source or individual campaign.
Enabling Ecommerce tracking isn’t the simplest thing to do, but here’s some info from Google to get you started: https://support.google.com/analytics/answer/1009612?hl=en
I hope this helps! If there’s anything else we can pass along that will be helpful don’t hesitate to reach out. I promise a quicker response next time!! Thanks again.
hello, sorry to bother you, but I saw your blog and I thought it could help me out with Google Analytics, I wanted to ask if by chance you could explain to me why when I go to view the user to see the flow path, because in practice when I see the way I get only the landing page identified by a “/” and so do not know in practice what they see virtually on my site.
Another problem I have is that when I set the gool to see how many people sign up to the newsletter gives me the result is always 0 even if you are enrolled in so many … can you help me? thank you.
greetings Andrea
Thanks for the comment Andrea. Google Analytics is an incredible tool, but it can also be tough to make sense of at times. That “/” you are seeing is your homepage. So all visitors landing on “/” are actually landing on your homepage.
In terms of the goal not tracking correctly, that’s going to be more difficult for me to diagnose since there are a whole bunch of things that could be causing this issue. The best thing to do is discuss it with the person that built your site. They should be able to help you get the goal set up correctly. Here’s a resource from Google on setting up goals that should be helpful: https://support.google.com/analytics/answer/1032415
Best of luck!
Hi, Great article, I was wondering if you could tell me why my landing pages in Google Analytics is showing no data? All of a sudden I had data and now nothing and I can’t figure out what to do!!
Thanks 🙂
Thanks a lot for your comment Pauline! Unfortunately without getting into your account and seeing what’s going on, it’s hard to diagnose what the culprit may be. When did you stop receiving data? Did you change anything on the site or within Google Analytics just prior to this issue showing up?
In case it’s helpful, here’s a post outlining some common issues with Google Analytics setup that could be a nice place to start troubleshooting: https://support.google.com/analytics/answer/1009683?hl=en
Hi thanks for your reply David,
I was informed in WordPress Forum it is probably a plugin, but I deactivated them all and no change.
I have now added the Javascript Tracking Snippet (Analytics.js) as suggested in above link, and just wondering if you think this is a good idea?
Sorry to hear you’re still having trouble with the tracking code Pauline. Plugins could be a good place to start, but it sounds like you’ve ruled that out. It is really hard to diagnose without actually getting in there to see what’s going on, but there are a few things you can check.
First, are you seeing the tracking code in the source code for the landing page?
If it’s there, does the account information match the account you’re accessing when you log into Google Analytics to see your data?
If it does, did you set up any filters that may be removing some of your data from the view you’re accessing in Google Analytics?
It could also be helpful to know if you’re using any sort of plugin to add Google Analytics to your site. The one we come across the most (because it’s pretty awesome) is Google Analytics by Yoast.
Hopefully something in the above helps, or at least points you in a helpful direction. Sorry I can’t give a more complete answer without getting into the code and seeing what’s going on. Good luck!!
Hi I think that you should try to use plugin Google Analytics Counter Tracker and instruction for users is on the site WordPress. Good luck.
Hi! Please tell me, how can it be that my landing page is displayed like:
/auth_required_customer.html?url=/customer/orders/111111111.html
As you see, this is order form.
This very page doesn’t exist even in Google index.
Hi Sonia. How often are you seeing this show up in your data? If it’s an isolated instance, it could be caused by some sort of strange user behavior. If it’s happening with every order that’s placed, it could be some sort of issue with your Google Analytics configuration. One thought that comes to mind is you could try looking at the traffic source that the particular visitor used to access that page. That may be able to help you gain some insight. You could also use the Navigation Summary to see what page they visited just before hitting the page in question.
Sorry I can’t be more specific. Without seeing the code it’s tough to give an incredibly specific answer. But hopefully that helps!
Hi! I have one problem with displaying my landing pages.
Some of them are shown like:
/auth_required_customer.html?url=/customer/orders/
/customer/orders/46955511.html
as you see this is technical page wich is closed from indexing.
Please give me some tips on fixing this problem so that I could see the real landing pages.
Thanks in advance!
Hi Sherry. It sounds like you’re having a very similar problem to Sonia above. It is tough to be too specific without seeing the code and the way everything is configured, but if this is happening with every order that’s placed (and not just an isolated occurrence) you could try:
1. Looking at the traffic source information to see how these visitors are being driven to this particular page
2. Looking at the Navigation Summary to see if there are any pages they’re viewing prior to the page in question (which is unlikely since this is being counted as a landing page, but I’d verify that in the data if it was me)
Hope that points you in the right direction!
Hi,
This has been really useful thanks.
Are you able to see conversion by actual page and not just the ones that have been landed on?
I’m trying to look into page performance.
Thanks
Jess
Hi Jess. Glad to hear the post has been helpful! Analyzing general page performance is actually a bit trickier than looking at something like conversion rates for landing pages. You typically end up looking at a variety of metrics in order to get a more complete picture.
A good place to start is with general page engagement data. Things like bounce rate and exit rate can give you some insight into what visitors are finding interesting. For a bit more on this, check out Website Data Most Nonprofits Should Be Tracking.
You’ll also likely want to use advanced segments to analyze page performance. If you filter by “Converters” you’ll be able to see which pages are viewed the most by people who ultimately convert on your site. You could further filter by individual goals you’ve set up on your site to get more granular info.
Finally, you’ll probably want to use the Funnel Visualization report to see what pages are driving the most visitors to ultimately convert. Here you’ll be able to see what page a visitor views just prior to completing each of your goals. You can access this report under Conversions >> Goals >> Funnel Visualization.
I hope that’s helpful. Thanks again for your comment!
By checking on landing page, We have more visits only on our career page. Maybe due to our openings results. And bounce rate is under 45 – 50 quite decent rate for our business. Wondering that our consulting service page not drawing as much effects. Hopefully Google Analytics helps us the idea to improve which page has to drive traffic more. Thanks for the landing page post very helfpul.
Thanks a lot for the comment! Glad to hear the post was helpful.
Thank you for this post I have learned something new today 🙂
You’re very welcome Ben. Thanks for the comment!
Hi David,
Can you tell me why there is a difference between the data of a page URL on ‘Landing page’ and the data from ‘All pages’?
Good question Saurav. The Landing Pages report is just showing you which pages visitors landed on when they entered your site. The All Pages report is showing you total pageviews. So if a visitor lands on Page A and then uses your navigation to visit Page B, Page A was their landing page. It would show up in the Landing Pages report with one session but Page B would not (since the visitor didn’t land on Page B as they entered your site). Both pages would show up in the All Pages report though with one pageview.
You can also see both pieces of information when you look at the All Pages report. The number in the “Entrances” column should align with the number of sessions you see in the Landing Pages report.
Hope that helps!
Thank You @David for this information
#33qamar
You’re very welcome Qamar!
Hi David,
Your article is very helpful, but I’m still having difficulty figuring out how to extract the exact data I need…
Basically, I want to be able see and export the following information:
> Landing Page – Page new user lands on
> Source – How they got to that page, e.g. PPC, organic search, social, etc.
I want to display the data as follows:
> http://www.homepage.com: 700 new users
Paid search – 200
Organic search – 100
Direct – 100
Referral – 100
Other – 200
> http://www.homepage.com/about-us :500
Paid search – 200
Organic search – 100
Direct – 50
Referral – 50
Other – 100
…etc.
I hope that makes sense. Is there a way that I can easily extract the information I need and export it to excel? We have loads of URLs that people land on and I don’t want to have to click onto each and manually copy out the data if I can help it.
I would appreciate any advice you can provide.
Thank you.
Thanks for the comment Rob. I can get you close, but unfortunately don’t think you’ll be able to get 100% of the way there directly within Google Analytics. If you go to the Landing Pages report, you can add a “Secondary Dimension” to the data that’s displayed. To do so, you’ll click the dropdown menu just above the data table that says “Secondary dimension.” Based on what you’re looking for, I’d add “Default Channel Grouping” to see the source for each landing page.
The big downside is this won’t show you the total visitors for each landing page as a whole anymore. It’ll now be broken out by traffic source. You could always export the Landing Page report and then add the secondary dimension and export again. You could also add the secondary dimension in there and then sort by the Landing Page column to see all sources for one page together, but you’d still have to sum them manually to get your total visits for that page. The other big downside is they’ll be displayed alphabetically instead of with the most popular first.
The only other way to do this that I can think of is to export the data and do a little work in the spreadsheet it produces. Or, like you said, drill down into each page individually, which it sounds like isn’t ideal based on the quantity of pages you’re dealing with.
If you find a better way please let us know. Hope that helps!
Hi David, Great post!
I would like to recommend Google Analytics Counter Tracker plugin on WordPress is one of the best you can use this days. It is very easy to use and it is compatible with almost every version of WordPress. You get detailed and concise analysis of your website guest and a graphical representation.
Thanks a lot for the tip Betty! I haven’t used the plugin myself, but I’m curious to look into it.
Hi David,
I am having the same problem as lisa, not getting the subpages only the home page in the landing page as well in user flow
Please guide me.
Anita
Hi Anita. Sorry to hear you’re having trouble with gathering info on subpages. My guess is it has to do with the way the Google Analytics tracking code is installed on your site. Are you getting any sort of data for subpages (outside of landing pages)? Or is the homepage the only one?
If you’re talking about stpl.com, it looks like the tracking code is in fact the culprit. I’m seeing it installed on the homepage but not the About or Diamond Products pages. Making sure the tracking code is installed correctly and present on every page should get you what you’re looking for.
Hope that helps!
Hi David,
Thank you for your quick reply. I did so and now I’m getting the subpages also, but still I’m not getting the subpages in User flow.
Please guide,
Thanking you,
Anita
That’s great to hear the subpage data is showing up now Anita! Unfortunately without getting into your website code and Google Analytics install, it’s going to be hard for me to provide much insight into why this data isn’t flowing in the User Flow report. It does seem odd that you’d have subpage data for some reports and not others though. I’d give it a few days to see if data starts showing up. If not, you may want to talk with a developer about re-installing your Google Analytics tracking code to make sure it’s done properly across the site. Hopefully that’ll solve the issue!
Am currently using Google Analytics Counter Tracker and is very useful, simple and easy to operate with various unique features such as mobile-friendly design and also helps to detect which browser or operating system used by visitor. https://wordpress.org/plugins/analytics-counter/ Check it out..
Thanks for the tip Boadu.
Thanks for this, very helpful indeed!, keep it up
You’re very welcome Elyson. Glad to hear it was helpful.
Can any one tell me in my analytics landing pages report usatoday.com website what is that? is this any hacking my website is hack or what?
Hi Loren. Sorry to hear you’re having trouble with the landing page data. But it probably doesn’t mean your website has been hacked. Can you tell me exactly what is showing up in the Landing Page report? And are you seeing other landing page data that matches what you’d expect to see on your own website? Without seeing the data, it can be tough to diagnose what’s going on, but hopefully we can get you pointed in the right direction.
I’m seeing usatoday.com and foxiness.com as landing pages under shared URLs today too. I’m also seeing other landing page data that matches what I’d expect to see for my blog.
I have the exact same data. It says usatoday.com, and the rest are all pages that are actually on my website.
That’s very odd. Without being able to see the data it’s tough to diagnose exactly what’s going on. But when you click on the usatoday.com landing page, then click “Source” in the Primary Dimension (just below the line chart of data), what do you see? Is it all coming from one traffic source? Or do you see multiple sources sending this traffic? Hopefully this will give us some insight.
I have it too. It says it’s coming from Twitter.
Thanks Elissa. You all are definitely not alone in seeing a recent spike from usatoday.com and foxiness.com. This looks like a recent spike in spam. You can read more about the details of where it comes from here: https://www.ohow.co/fake-twitter-com-referrals-google-analytics/
If you need to remove this spam, you can also check out the guide he has linked at the end of that article. It isn’t the easiest of filters to set up on your own, but hopefully it’ll point you in the right direction.
I hope that helps!
The other option you could try (that is a whole lot simpler) is to enable bot filtering in Google Analytics if you haven’t done so already. To do this:
1. Log into the view with this spam and click “Admin” in the menu at the top
2. Select “View Settings” in the far right column
3. Scroll down until you see the checkbox that says “Exclude all hits from known bots and spiders” and check it
4. Hit the blue “Save” button
This won’t remove the spam already in there, but depending on how these bots are coming in it could help to curb some of it in the future.
Hello,
Great Article!! My question doesn’t seem to be shown/ answered anywhere though.
Can you please describe the necessary steps to take to set up the Landing Pages Tracking in the first place? For example, under Behavior > Landing Pages … What is the process in the first place to set it up that your landing pages are shown in this tab?
Much appreciated!!
Hi James. Thanks a lot for the kind words! You shouldn’t need to do anything special to get landing page tracking set up. Once you get Google Analytics tracking set up on your site, you should be all set. For more on setting up Google Analytics in general, check out Set Up Analytics Tracking.
Hope that helps!
Hello, thank you for the article! We have an old landing page which is still hosted from the website, and due to Google indexing it still pops up sometimes. However all of a sudden, we’re getting loads of enquiries from that landing page. We’ve solved the issue with a redirect, but I would like to investigate these users’ behaviour. How did they land on THIS landing page, which keywords did they search, why is it popping up now, that sort of thing. Not being a fundi in Google Analytics, there’s been many occasions where I’ve wanted to see that behaviour flow but haven’t been able to. I’ve played around with the funnels and user flows, but the User Flow page shows that everyone who landed on this landing page came from “All Features” which means nothing to me. If anyone is able to help and advise how I can get to the full picture of the behaviour – from searching right up to the end – I would be forever greatful!
Hi Wendy. Thanks for writing up such a detailed comment. Without seeing your analytics specifically it’s tough to know exactly what’s going on, but hopefully we can help out. I’d start by looking into the traffic source information to see what sources are driving these particular visitors. There are a few steps to this process, but hopefully this will be worthwhile.
First, copy the URL for the landing page in question. You only want the portion of the URL after your root domain. So if the landing page is http://www.domain.org/xyz/, you only need to copy the /xyz/ portion.
Next, head over to the Channels report. You can find this under Acquisition >> All Traffic >> Channels. This will show you the channels driving traffic to your site. But we only want to see traffic for the landing page in question. So we’ll need to add a Secondary Dimension.
Just above the data table, click the dropdown that says “Secondary dimension” and type Landing Page. When you see a green box that says “Landing Page” click it. You’ll now see the channels driving traffic to all of your individual landing pages. But we now need to add a filter to remove all of the pages we aren’t interested in at the moment.
To do so, click on the “advanced” link beside the search field just above the data table. This will open advanced options for us to add a filter. Click the green box that says “Default Channel Grouping” and select “Landing Page” instead. In the text box on the right, paste the URL for your landing page (that /xyz/ from our above example). The whole filter should read ‘Include + Landing Page + Containing + /xyz/’. Click the grey “Apply” button.
And that’s it! You should now see the traffic source info for this particular landing page. You can drill down into each to get additional info. So, for instance, if you have a lot of Referral traffic, click on it and it’ll show you what sites are sending it your way.
Sorry for the lengthy directions. If anything in there is confusing, just let me know where you’re getting stuck and I’ll clarify. Hopefully that helps!
Thanks for commenting, Vera! We’re so glad you found it helpful.
Thank you. Exactly the information I needed. Thanks for sharing.
Thanks for commenting, Helena. Glad you found the post helpful!
Hi, I have a website http://www.givyo.co and submitted to webmaster and I am trying to see in analytics the impression for the landing pages, I can’t see where this is in analytics. Could I be pointed in the right direction?
Thank you
Hi Darren. You should be able to get to the Landing Pages report in Google Analytics by visiting Behavior >> Site Content >> Landing Pages. You can take a look at the “Sessions” column to show how many visitors landed on that particular page. Hopefully that helps!
Hi David! I was looking at behavior flow of my site, somehow it showed “/” instead of homepage title or any other info. Is there some way to change “/” to page title ?
Thanks in advance.
Hi Warsi. Good question on the page title front. Within the Behavior Flow report, it looks like you’re going to have to stick to page URL. So “/” is going to represent your Homepage.
In other reports, to show page names instead of URLs you’re going to be looking for “Page Title” as your dimension. On some reports (like Behavior >> Site Content >> All Pages), you’ll be able to set this as your Primary Dimension. On others (like the Landing Pages report outlined in this post), you can set it as a Secondary Dimension. When it’s secondary, you’ll see your page titles displayed in a column to the right of the page’s URL.
Hope that helps.
Hi, I have a website https//theyuvas.com and submitted to webmaster and I am trying to see in analytics the impression for the landing pages, I can now see where this is in analytics.
Thank you
Thanks for the comment Dev. It sounds like you’re all set with pulling landing page data, but if there’s anything we can help with, just let me know.
This post does not answer the most important question – if “landing page” is per-session or per-user?
Hey Alex. The landing pages you’ll find outlined in this report are all per session. Hope that’s helpful in getting the most out of your data.
Hi,
I come late to this conversation, but so far this is in the only article I have found related to the question I have, and it has not being asked in the comments yet. So I hope you can help me.
When I pull the landing pages in my analytics account some of them display my primary domain (amberusa.com) at the end of the landing page URL.
Something like: /blog/types-of-ct-machines/amberusa.com
This wasn’t really an issue until I noticed that when I pull the Organic Traffic Insights report from my SEMRush account those specific pages do not have any information on the keywords that were used to land there. Whereas, the pages that do not have the primary domain at the end do display keyword information.
So clearly my question is, how is this happening and how I fix it?
Thanks for reaching out Andres. It’s hard to diagnose exactly what may be going on without seeing your Google Analytics setup, but my best guess is there is a setting under your View Settings that may be a bit off.
I’d start with the Default Page field as outlined in this thread on the Google Forums to see if that does the trick: https://support.google.com/analytics/thread/3384648/error-domain-name-repeated-at-end-of-domain
I hope that helps!
Hi David,
Thank you so much for your response, It was exactly what you said. The Default Page field had our main domain in there.
Now that I have removed it, landing pages are not showing the primary domain after the url.
I do appreciate your help in pointing me to the correct solution.
Glad to hear it did the trick Andres!
Thanks a lot for sharing this! I didn’t know that google analytics also shows the bounce rate. I think it’s great they included it since it is a good factor to know if the landing page needs improvement. Do you also have some tips on making a high-converting landing page?
Sure thing! Here are a couple of resources to check out:
Hopefully those are a good place to start.