

Have you ever wondered how people are actually finding your website? Understanding your traffic sources can tell you a lot about where your visitors are coming from — and how your marketing efforts are paying off.
In this short video, I’ll walk through how to use Google Analytics 4 to see where your website traffic is coming from and evaluate your marketing.
This video is one of several excerpts from our Nonprofit Website Office Hours on Google Analytics 4. You can also see the full recording on YouTube.
Video Transcript
This transcript has been lightly edited for clarity.
Traffic sources. I feel like this is one that a lot of people find really interesting. If you or your boss or your board have ever wondered how folks are finding your website, this is the report for you.
It’s going to help us understand where visitors are coming from and what sources are sending people to our website.
It’s going to help us answer questions like:
- What channels are driving the most traffic?
- What channels are driving the most engaged traffic to our site?
- Do the results we’re seeing from each channel justify the time we’re spending there?
This last question I actually think is especially helpful for people looking to understand how your marketing efforts are paying off.
Maybe you use social media and email marketing and maybe even some paid ads to drive folks to your website. A report like this can help you see how those efforts are working and compare them to one another and say, “Is it worth the time? Is it worth the money that we’re putting into these different channels?”
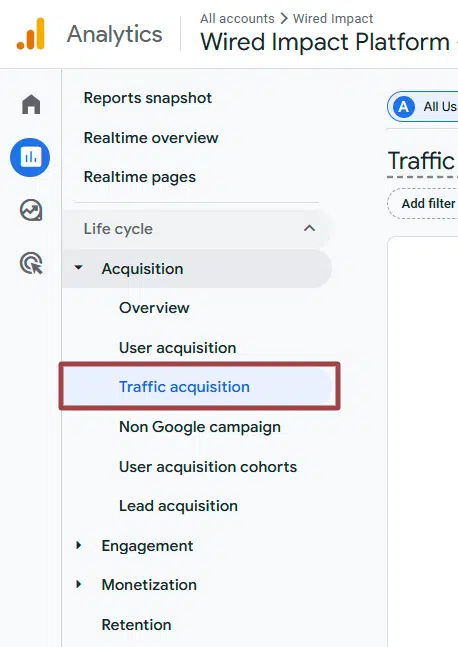
Getting into Google Analytics, how do we actually find that? We’re still in Reports over here. We’re still in Life cycle. We’re going to open up Acquisition and come down to Traffic acquisition.
This is a relatively new feature in analytics; they’re using some AI to crunch the numbers and pull out some insights for you. Sometimes they’re helpful, sometimes they’re not. You can definitely read them over if you want.
You’ll see this report is showing our most common traffic sources. It’s showing direct traffic drove the lion’s share of traffic here. Almost 98.5% of our total traffic came from direct traffic.
And then next was referral, with just under 1%. (This is because we’re using demo data, so that’s why these are so low.)
In case it helps, you can find a breakdown of definitions for the most common traffic sources you’re likely to find in Google Analytics.
And one cool thing, you can also see engaged sessions. And if I hover over it, you’ll see the definition there saying “The number of sessions that lasted longer than 10 seconds, or had a conversion event, or 2 or more screen or page views.”
So basically, it’s not hollow traffic. It’s not people who landed on your site and immediately bounced.
It’s people who were on the site for at least 10 seconds or took some sort of action on the site. Maybe they clicked something to go to a new page or did something that triggered a conversion event (which we’re not going to get into too much today).
Then you can see the engagement rate, which is just the math between these two columns. Again, average engagement time. And then we can start to see some events (which we’re not going to get into today), but you can start to see which pages are driving events on the site.
If you want to get back to that report, here it is again: Life cycle >> Acquisition >> Traffic acquisition.
What You Should Do Now
01. Come to Nonprofit Website Office Hours
We cover a new topic every few weeks. Plus get a live answer to any website-related question you're wrestling with.
02. Book a Website Call
Find a time to discuss your nonprofit's website needs. Discover what's worked for other nonprofits like you and see how easy building your new site can be.
Comments