
You might be curious about the languages your visitors speak, especially if your nonprofit serves a large, diverse community. Automatic browser translation definitely helps bridge the gaps, but it may not always capture the nuance of your work.
In this short video, I’ll walk you through how to use Google Analytics 4 to see what languages your visitors actually speak and whether investing in manual translation is worth it.
This video is one of several excerpts from our Nonprofit Website Office Hours on Google Analytics 4. You can also see the full recording on YouTube.
Video Transcript
This transcript has been lightly edited for clarity.
We’re going to look at languages. I think this report is really helpful. It helps you know if looking into an alternative to automatic, browser-based language translation is going to be worthwhile.
Specifically, it can help you answer questions like:
- What languages does our audience speak?
- Are we adequately meeting the needs of visitors who speak other languages when they visit our website?
- How much do we need to invest in improving the experience for visitors who speak a language other than the one our content is presented in?
In terms of how we find that, let me jump back into Google Analytics. We’re jumping to a whole new part of analytics here, so I’m going to close out of Life cycle.
We’re going to be in this User section of Reports, and I’m going to open User attributes and click on Demographic details.
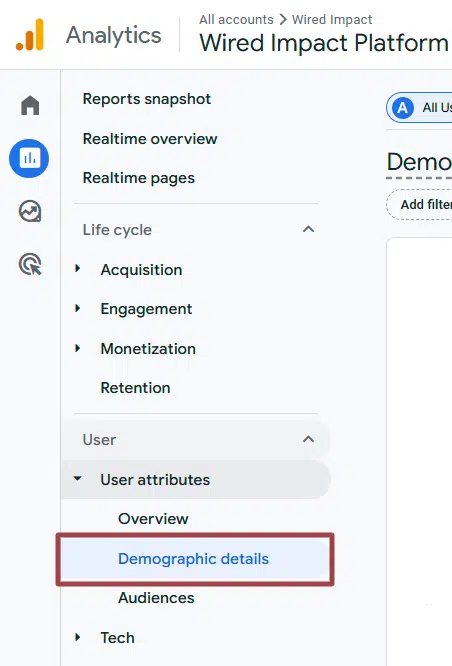
And you’ll see by default, this is showing a country report, which can also be really interesting. You can see where in the world people are coming to your website.
But to jump this over to languages, we’re going to click this dropdown here where it says “Country” and we’re going to select “Language” from this dropdown.
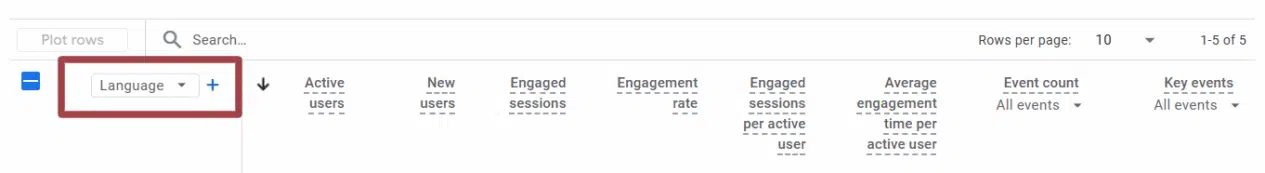
You can see right away that 97.5% of visitors to this website had their browser set to English. We are predominantly serving English-speaking folks with this website, which is helpful information to know.
And then we can start to say, “Okay, what did engagement look like?” These numbers are so small that there’s not going to be a whole lot of statistically significant value to this data.
But if your mix looks different — maybe you have 25% of your visitors speaking a different language, or maybe more depending on the nature of your work — you could start to say, “Okay, what do engaged sessions look like for those visitors? What does the engagement rate look like?”
“We have a 23% engagement rate for English speakers. What does that look like for Spanish speakers? French speakers? German speakers?”
And then we can start to see average time, again, can be useful. Looking at the relative average time there, you want numbers that are a little bit bigger than this to do that sort of cross-cohort comparison.
But hopefully this is at least helpful in answering some of those questions, like what languages are people speaking when they come to our website? And how much do we need to invest in the experience for folks who speak a language other than the one our content is predominantly presented in?
Again, in terms of how you get there: User attributes to Demographic details and then just remember to adjust that dropdown from the default “Country” to “Language” instead.
What You Should Do Now
01. Come to Nonprofit Website Office Hours
We cover a new topic every few weeks. Plus get a live answer to any website-related question you're wrestling with.
02. Book a Website Call
Find a time to discuss your nonprofit's website needs. Discover what's worked for other nonprofits like you and see how easy building your new site can be.
03. Start a Free Website Trial
Try our nonprofit website platform for yourself. Instantly get access to every feature to see if it's the right fit for your needs. No credit card required.
Comments